UpviseJS : Tools
UpviseJS Cloud IDE
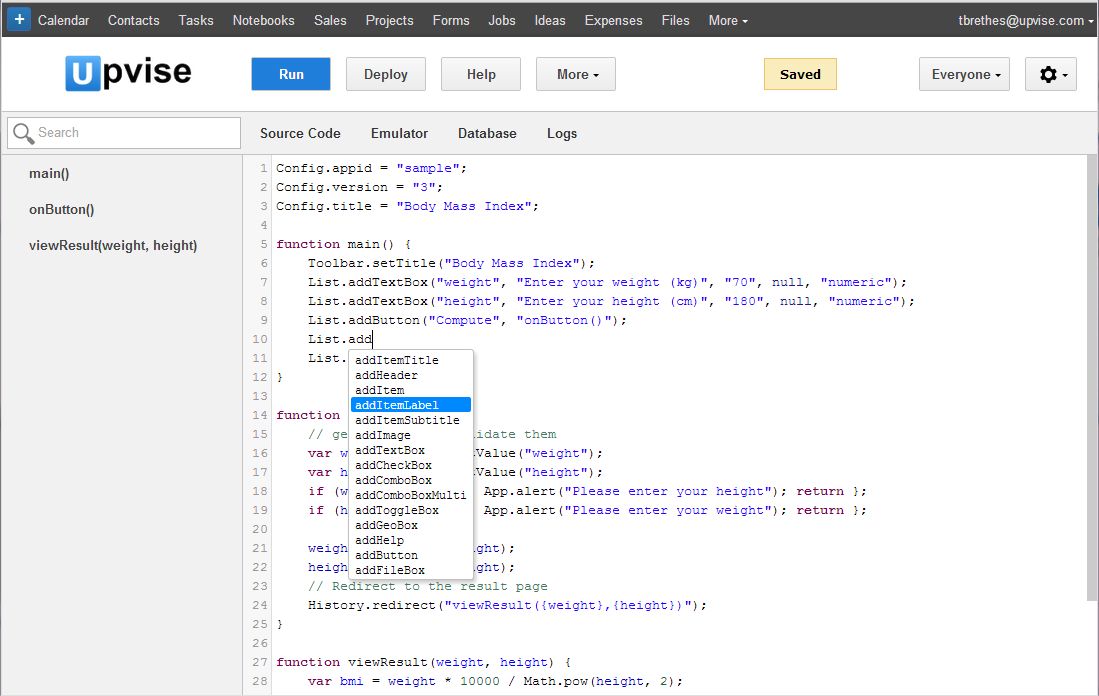
Upvise JS comes with a cloud based IDE and its emulator to create, run and debug your UpviseJS apps:
- Runs in a web browser, nothing to install or to configure
- Rich source code editing: syntax highlighting, auto-complete, code structure, instant search
- Built-in emulator for phone, tablet or wrb form factor
- Contextual help
- Database viewer and Console Logs
- Integrated with Chrome debugger
Setting up your environment
- Create an Upvise Accountt on your web browser
- Install the Upvise native app for Android. On your phone / Tablet : Start Google Play, search for Upvise and Install it
- Start Upvise on your phone and sign in
- Sign In to your Upvise Web Account on your computer
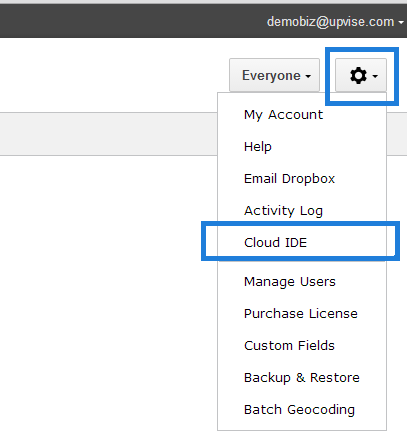
- Click on the Settings icon (top right) and click on Cloud IDE menu item
Emulator
The Upvise Cloud IDE contains an web based emulator which simulate the screen size of a phone or a tablet to give you a better look and feel of the application you are designing on a smaller device. You can choose to run and debug you application using the Phone / Tablet or Web target, but click on the right item on the top black bar in the emulator window.
Debugging in the Emulator
Because the UpviseJS Emulator runs inside a web browser and your application is a javascript application, you can take advantage of the Chrome browser built-in debugging features.
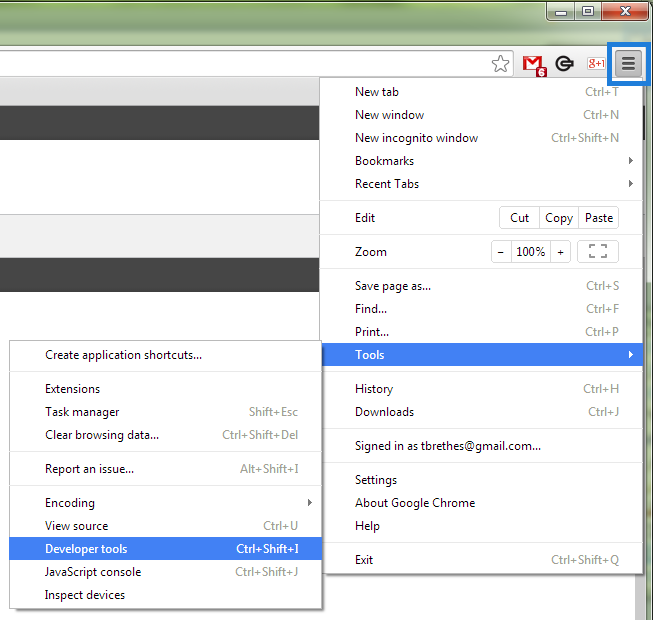
- Click on the menu icon in Chrome (top right on the screen) and click Tools > Developper Tools (or Ctrl+Shift+I). This will open the Chrome developer frame at the bottom of the browser window.
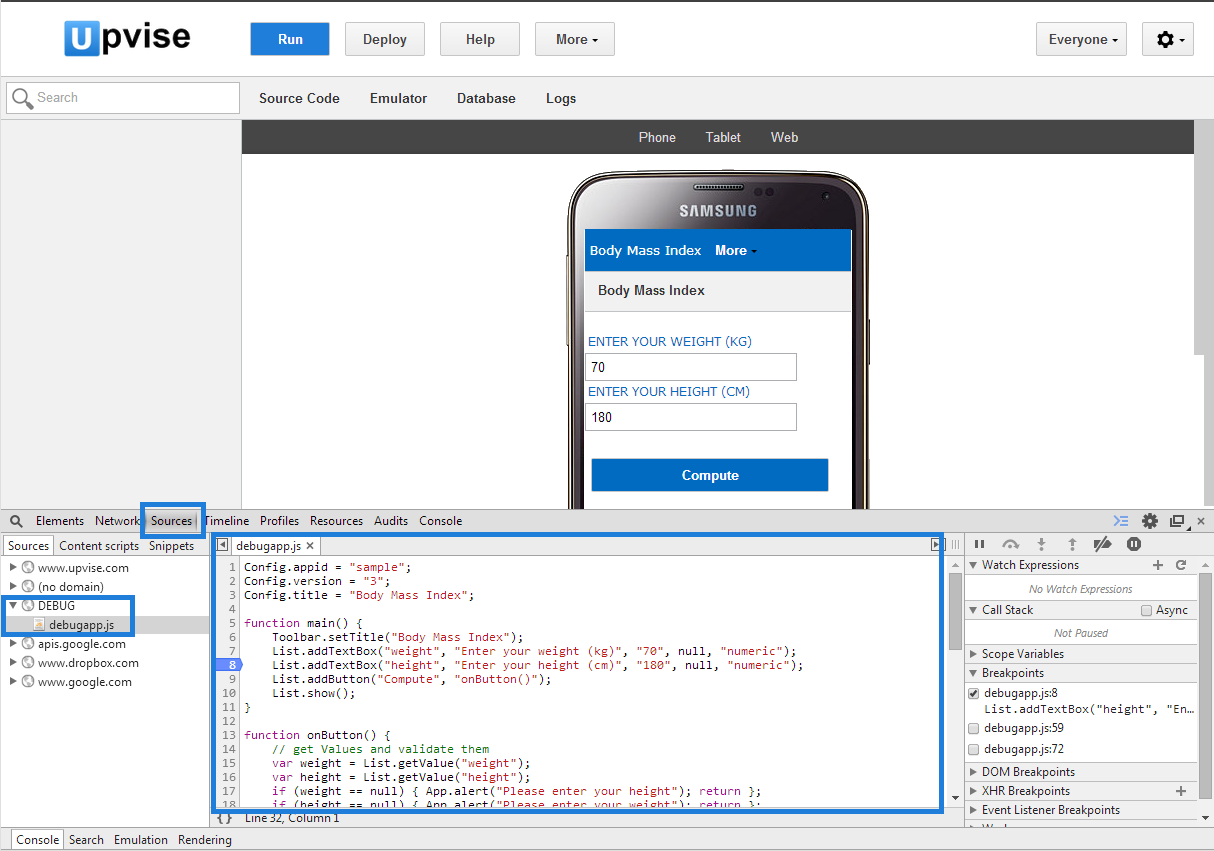
- Click on Source tab and then on the item "DEBUG" domain to expend the source file list.
- Click on "debugapp.js" item, this will display the source code of your application
- click on any line number to add . remove a breakpoint
Deployment
To deploy your application in your account is make it available to all users, simply Click the
Deploy Button.
Debugging on the phone
You can use a Config.debug = "true" in your application to enable error display on the UpviseJS native application when your app generates an error.
UpviseJS Eclipse plugin
An eclipse plug-in for UpviseJS is currently under development. It will allow to use the Eclipse javascript IDE features, along with more powerful features such as multiple source code files import will be released in fall 2014.
Common Error Messages
Uncaught TypeError: undefined is not a functionYou are calling a bad method name on a UpviseJS object. Check the casing and wording of your method name
No error but nothing is displayed on the Emulator or phone screenMake sure you have a List.show() at the end of the function who displays items on the screen